Multiple Choice
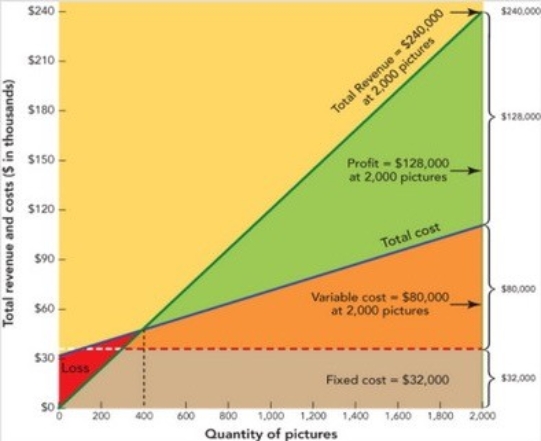 Figure 11-7
-Figure 11-7 above depicts a
A) Gantt chart.
B) demand curve.
C) break-even chart.
D) ROI analysis.
E) cross-tabulation.
Correct Answer:

Verified
Correct Answer:
Verified
Related Questions
Q5: It costs Lady Marion Seafood, Inc., $30
Q41: While pricing objectives frequently reflect corporate goals,
Q82: All of the following are profit-oriented approaches
Q107: During the iPad's _ stage of its
Q135: Setting the highest initial price that customers
Q138: Hormel offers its food distributors a discount
Q139: <img src="https://d2lvgg3v3hfg70.cloudfront.net/TB8552/.jpg" alt=" Figure 11-6a -In
Q141: What is bait and switch? Give an
Q144: Tim Marlow, the owner of The Clock
Q212: If a firm's profit is high enough