Multiple Choice
 Marketing Dashboard Map
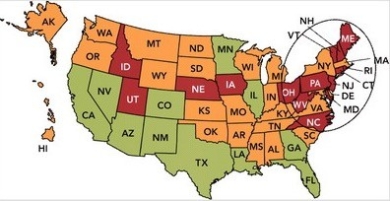
-In the marketing map above, the annual growth rate in each state is shown. There are 11 "good" states (CA, NV, AZ, NM, CO, TX, LA, MN, IL, GA, and FL) and 15 "bad" states, meaning very poor states (ID, UT, NE, IA, OH, WV, NC, PA, MD, NJ, CT, RI, VT, NH, and ME) . If you were a marketing manager faced with this dashboard, which of the following would be the best action?
A) focus on the shortfalls in Idaho and Utah
B) revise the relevant goals for both the East and West Coast
C) conduct additional market research in the Southern United States
D) examine your distribution system in the Northeastern United States
E) change the marketing metric being used to evaluate cities individually
Correct Answer:

Verified
Correct Answer:
Verified
Q25: A product that disrupts consumers' normal routine
Q27: At the time of its introduction, which
Q60: The two main classifications of business products
Q129: The emergency room staff in Houston's largest
Q175: The addition of Clorox II bleach to
Q190: You greatly admire a set of Waterford
Q191: In terms of promotion, which of the
Q193: IDEO is a company that<br>A) creates innovative
Q221: Marketing dashboards are useful in measuring actual
Q235: Compare continuous, dynamically continuous, and discontinuous innovations.