Multiple Choice
Figure 6-8
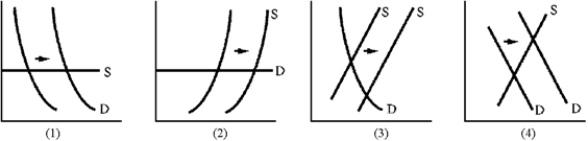
-Libya sold more crude oil in 1985 than it sold five years earlier, but revenues were 17 percent less.Which graph in Figure 6-8 is consistent with this set of facts?
A) 1
B) 2
C) 3
D) 4
Correct Answer:

Verified
Correct Answer:
Verified
Related Questions
Q20: Cross elasticity of demand measures the responsiveness
Q68: The demand for French Roast coffee is
Q109: John's Bait Shop was surprised to learn
Q137: Arrange the following goods from least to
Q141: Which of the following goods will have
Q142: Along a straight-line demand curve the<br>A)slope is
Q142: The cross elasticity between two goods has
Q148: A horizontal demand curve is perfectly elastic
Q160: Along a straight-line demand curve (dropping all
Q239: Would a profit-maximizing firm sell at a