Multiple Choice
Figure 6-9 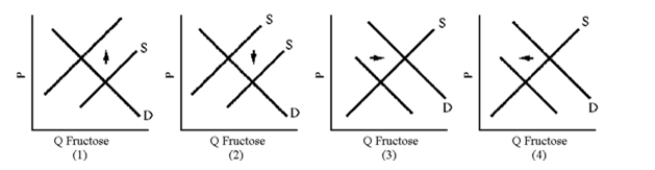
-In 1983, government price supports raised the price of sugar above its equilibrium value.Which graph in Figure 6-9 illustrates the impact of sugar price supports on the sugar substitute fructose?
A) 1
B) 2
C) 3
D) 4
Correct Answer:

Verified
Correct Answer:
Verified
Related Questions
Q78: Figure 6-2 <img src="https://d2lvgg3v3hfg70.cloudfront.net/TB8592/.jpg" alt="Figure 6-2
Q79: If the price elasticity of demand for
Q80: Certain goods are related such that an
Q81: If a study shows that two goods
Q82: If goods X and Y are complements,
Q84: If price goes up 20 percent and
Q85: Necessities, such as food and shelter, are
Q86: If two goods are complements, their cross
Q87: In a past fare war, U.S.Air reduced
Q88: The quantity demanded in a market depends