Multiple Choice
Figure 7-5 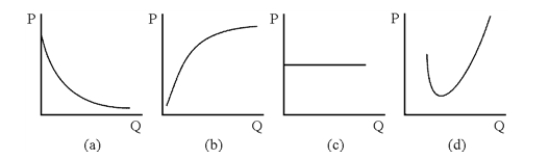
-Which of the graphs in Figure 7-5 could be a firm's total fixed cost curve?
A) (a)
B) (b)
C) (c)
D) (d)
Correct Answer:

Verified
Correct Answer:
Verified
Related Questions
Q81: A firm practices input substitution when it<br>A)retrains
Q82: Whether or not a production process shows
Q83: Total physical product shows what happens to
Q84: Some costs cannot be varied within a
Q85: Diminishing marginal returns explains why a firm's
Q87: An airline industry study recently reported, "Evidence
Q88: The firm can calculate all points on
Q89: Figure 7-4 <img src="https://d2lvgg3v3hfg70.cloudfront.net/TB8592/.jpg" alt="Figure 7-4
Q90: If the MRP per dollar is greater
Q91: Economies of scale lead to declining long-run