Multiple Choice
Figure 7-8
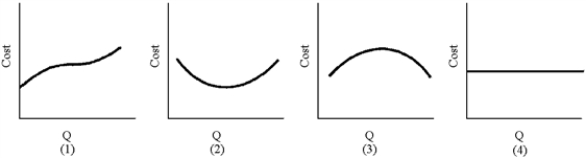
-Of the graphs in Figure 7-8, which resembles marginal cost?
A) 1
B) 2
C) 3
D) 4
Correct Answer:

Verified
Correct Answer:
Verified
Related Questions
Q14: "A producer wanting to employ optimal quantity
Q36: The rule for the optimal use of
Q41: If the MPP of labor is 60
Q58: A.B.Denson Company had been employing 6 workers
Q128: The optimal level of resource use comes
Q143: The short run is the time period
Q144: Figure 7-13 <img src="https://d2lvgg3v3hfg70.cloudfront.net/TB8592/.jpg" alt="Figure 7-13
Q153: When economies of scale are present,<br>A)costs per
Q210: Peter Piper picks a peck of pickled
Q242: Average physical product measures the output per