Multiple Choice
Figure 5-1
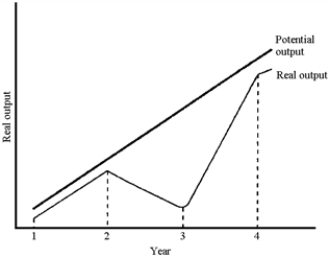
-Figure 5-1 plots potential and real output for a hypothetical economy.Based on this graph, the recession occurred
A) between years 1 and 2.
B) between years 2 and 3.
C) between years 3 and 4.
D) after year 4.
Correct Answer:

Verified
Correct Answer:
Verified
Related Questions
Q141: What are intermediate goods? Why do economists
Q142: Aggregate demand and supply curves have been
Q143: Technological change, such as the information technology
Q144: Growth in GDP systematically understates the growth
Q145: How does the calculation of GDP include
Q147: In 1981, the Reagan administration employed a
Q148: Macroeconomics is best described as a study
Q149: In contrast to the post-World War II
Q150: What is an aggregate? How is it
Q151: Gross domestic product is a dollar measure