Multiple Choice
Figure 5-2
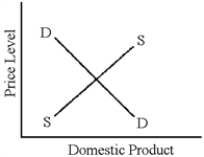
-In Figure 5-2, if the aggregate demand curve moves to the right less rapidly than the aggregate supply curve, then
A) the price level should decline over time.
B) the price level should remain stable.
C) the price level will tend to increase.
D) the level of real GDP should decrease.
Correct Answer:

Verified
Correct Answer:
Verified
Q110: "Underground" economic activity can best be described
Q111: The price controls on consumer goods during
Q112: The horizontal axis on the aggregate demand-aggregate
Q113: In the 1960s, U.S.economy experienced<br>A)a substantial decline
Q114: Stagflation is the simultaneous occurrence of inflation
Q116: Usually, increased government spending for war increases
Q117: During economic fluctuations, individual markets usually move
Q118: Corrected for inflation, the real GDP was
Q119: In macroeconomics, the vertical axis in a
Q120: In response to the "Great Depression 2.0,"