Multiple Choice
Figure 10-6
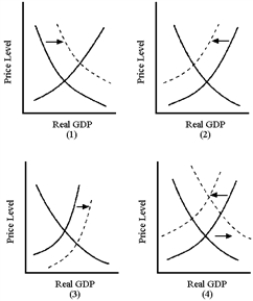
-In Figure 10-6, which graph best illustrates an adverse supply shock accompanied by an increase in government spending?
A) -1
B) -2
C) -3
D) -4
Correct Answer:

Verified
Correct Answer:
Verified
Q181: The case for government stabilization policy is
Q182: Figure 10-4<br> <img src="https://d2lvgg3v3hfg70.cloudfront.net/TB8592/.jpg" alt="Figure 10-4
Q183: Supply-side economics concerns itself with the interaction
Q184: The aggregate supply curve is the relationship
Q185: The economy's self-correcting mechanism appears to be
Q187: An increase in the price level causes
Q188: When equilibrium GDP is below potential GDP,
Q189: If the price level decreases, what will
Q190: An inflationary gap will exist when<br>A)aggregate demand
Q191: Many economists describe the 2007-2009 period in