Multiple Choice
Figure 11-3
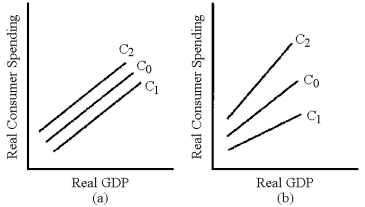
-In Figure 11-3, which line represents the change in the consumption schedule caused by a cut in the personal income tax as advocated by President George W.Bush in 2001?
A) C₁ in graph (a)
B) C₂ in graph (a)
C) C₁ in graph (b)
D) C₂ in graph (b)
Correct Answer:

Verified
Correct Answer:
Verified
Q8: After September 11, 2001, President George W.Bush
Q35: How do transfer payments function as negative
Q76: Explain some of the steps that a
Q92: For conservatives, the United States needs<br>A)an expanded
Q105: Most economists seem to agree that cutting
Q111: Liberals tend to favor increasing taxes as
Q119: When total expenditures exceed the economy's potential
Q124: In the short run, tax cuts that
Q135: Figure 11-3<br> <img src="https://d2lvgg3v3hfg70.cloudfront.net/TB2059/.jpg" alt="Figure 11-3
Q162: The personal income tax varies as GDP