Multiple Choice
Figure 11-3
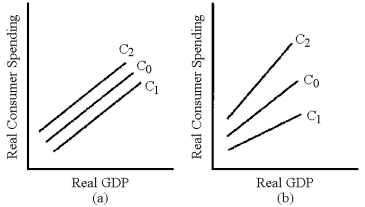
-In Figure 11-3, which line represents the change in the consumption schedule caused by an increase in the residential property tax?
A) C₁ in graph (a)
B) C₂ in graph (a)
C) C₁ in graph (b)
D) C₂ in graph (b)
Correct Answer:

Verified
Correct Answer:
Verified
Q67: Changes in government spending<br>A)are an indirect component
Q73: Historically, the government has used fiscal policy
Q78: Government purchases and income taxes have the
Q87: When the economy has an income tax
Q106: When income taxes are included in the
Q109: Contractionary fiscal policy may have some undesirable
Q130: If the MPC in the U.S.was low,
Q144: During the 2008 presidential campaign, candidate Barack
Q160: Supply-side tax cuts are more likely to
Q195: There is some agreement between the beliefs