Multiple Choice
Figure 19-3
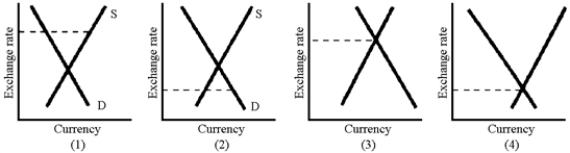
-Of the graphs in Figure 19-3, where the dotted line shows the actual exchange rate, which one shows a country with an undervalued currency and a balance of trade surplus?
A) 1
B) 2
C) 3
D) 4
Correct Answer:

Verified
Correct Answer:
Verified
Related Questions
Q107: The gold standard prevented a nation from
Q108: If the United States experiences an economic
Q109: The currency value of Agraria is set
Q110: A prolonged recession in Europe should decrease
Q110: The prospect of a recession in the
Q111: A deficit nation in a fixed exchange
Q113: Everything else being equal, one can expect
Q115: Why is the international financial system today
Q116: If Wisconsin cheddar cheese sells for $3.00
Q157: If Japanese tourists visit Yellowstone Park,what is