Multiple Choice
Figure 19-3
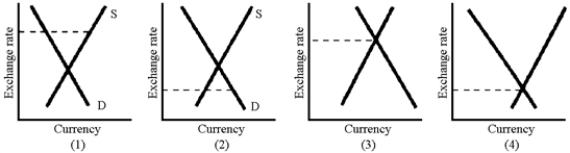
-Of the graphs in Figure 19-3, where the dotted line shows the actual exchange rate, which one shows a country with an overvalued currency and a balance of trade deficit?
A) 1
B) 2
C) 3
D) 4
Correct Answer:

Verified
Correct Answer:
Verified
Related Questions
Q161: IMF advice to countries such as Russia
Q162: The exchange rate between yen and dollars
Q163: Capital movements are typically the dominant factor
Q164: Which of the following companies would gain
Q165: When exchange rates are set by government
Q167: Under a gold standard,<br>A)with a balance of
Q168: The recent experiences in Greece, Portugal, and
Q169: Because the United States has had substantial
Q170: According to the purchasing power parity theory,
Q171: Balance of payments deficits arise whenever the