Multiple Choice
(Figure: Revenues and Output I) The total revenue curve for a perfectly competitive firm is represented by curve: 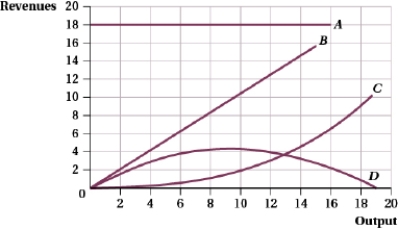
A) A.
B) B.
C) C.
D) D.
Correct Answer:

Verified
Correct Answer:
Verified
Related Questions
Q15: Suppose a perfectly competitive industry has 300
Q16: Use the following table to answer the
Q17: The idea that firms pursue actions to
Q18: Suppose that the cost curves of the
Q19: (Figure: Price and Quantity of Output and
Q21: (Figure: Price and Quantity of Output and
Q22: (Figure: Price and Quantity of Output V)
Q23: Suppose that there are 1,000 firms in
Q24: Suppose that the market for ice cream
Q25: Which of the following statements is (are)