Multiple Choice
(Figure: Price and Quantity I) The graph shows a firm's marginal cost curve. This firm operates in a perfectly competitive industry with market demand and supply curves given by Qd = 100 - 8P and QS = -20 + 2P, where Q is measured in millions of units. Based on the figure, how many units of output will the firm produce at the equilibrium price? 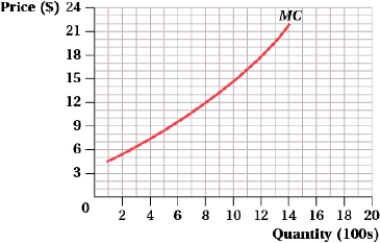
A) 1,100
B) 800
C) 1,200
D) 400
Correct Answer:

Verified
Correct Answer:
Verified
Q81: Suppose that demand increases. If the total
Q82: (Figure: Price and Quantity of Output I)
Q83: (Figure: Price and Quantity IV) Which of
Q84: (Figure: Profit-Maximizing Output Level I) What is
Q85: Suppose that the perfectly competitive market for
Q87: (Figure: Firm I) At the profit maximizing
Q88: Suppose that each firm in a perfectly
Q89: Suppose that the market for gourmet deli
Q90: Suppose that each firm in a perfectly
Q91: Suppose that the market for ice cream