Essay
(Figure: Capital and Labor IV) 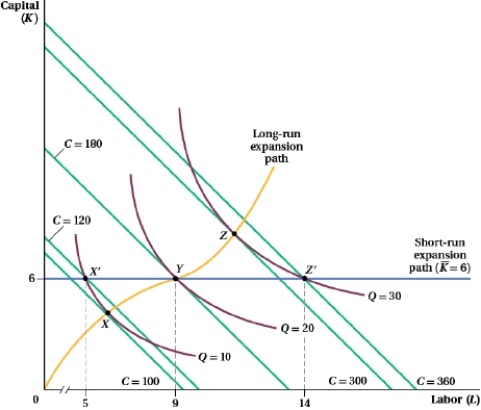
Where the firm is producing at point Y, graph the:
a. short-run total cost curve, showing the total cost at 10, 20, and 30 units of output.
b. long-run total cost curve, showing the total cost at 10, 20, and 30 units of output.
c. short-run ATC curve, showing the ATC at 10, 20, and 30 units of output.
d. long-run ATC curve, showing the ATC at 10, 20, and 30 units of output.
Correct Answer:

Verified
a. and "b.  " c. and...
View Answer
Unlock this answer now
Get Access to more Verified Answers free of charge
Correct Answer:
Verified
View Answer
Unlock this answer now
Get Access to more Verified Answers free of charge
Q58: Complete the following table. <img src="https://d2lvgg3v3hfg70.cloudfront.net/TB8428/.jpg" alt="Complete
Q59: Use the following table to answer the
Q60: Sanjay's hair salon has a total cost
Q61: A firm with a production function Q
Q62: A firm with a production function Q
Q64: Which of the following factors are likely
Q65: Meera operates Ducks Unlimited, which raises mallard
Q66: Suppose a firm's total cost function is
Q67: A firm with increasing returns to scale
Q68: A firm produces two goods, Q<sub>1</sub> and