Essay
(Figure: Cost and Quantity of Output IV) Using the information provided in Figure 7.18, graph the firm's MC, ATC, and AVC curves in one diagram. 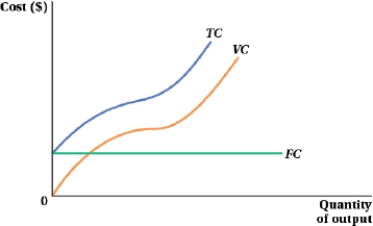
Indicate the minimum points on the AVC and ATC curves. In a separate diagram, show the firm's AFC curve.
Correct Answer:

Verified
The MC curve will in...View Answer
Unlock this answer now
Get Access to more Verified Answers free of charge
Correct Answer:
Verified
View Answer
Unlock this answer now
Get Access to more Verified Answers free of charge
Q52: A business anticipates future operating revenues of
Q53: An entrepreneur gathers the following information to
Q54: A firm has a production function of
Q55: A firm has a production function of
Q56: Sanjay's hair salon has a total cost
Q58: Complete the following table. <img src="https://d2lvgg3v3hfg70.cloudfront.net/TB8428/.jpg" alt="Complete
Q59: Use the following table to answer the
Q60: Sanjay's hair salon has a total cost
Q61: A firm with a production function Q
Q62: A firm with a production function Q