Multiple Choice
(Figure: Coffee and Energy Drinks I) 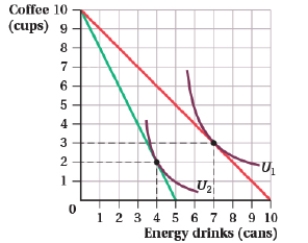 Suppose the consumer has $10 to spend on energy drinks and coffee. Which of the following figures represents the consumer's demand curve for energy drinks?
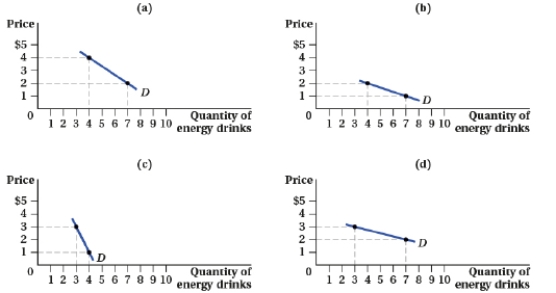
A) panel (a)
B) panel (b)
C) panel (c)
D) panel (d)
Correct Answer:

Verified
Correct Answer:
Verified
Related Questions
Q57: (Figure: Good Y and Good X X)
Q58: Suppose that there are two goods, X
Q59: (Figure: Quantity of Goods Y and X
Q60: Ana, Marcia, and Juliana are the only
Q61: (Figure: Quantity of Goods Y and X
Q63: (Figure: Market for DS Video Games I)
Q64: Joaquin consumes pizza and beer. His utility
Q65: Suppose the price of a Giffen good,
Q66: A consumer's bundle includes two normal goods,
Q67: (Figure: Units of Good Y and Good