Essay
(Figure: Price and Quantity of Skirts I) This graph shows the demand curve for skirts. Suppose the consumer has $500 to spend on skirts and handbags, and the price of handbags remains unchanged at $100. Using budget constraints and indifference curves, placing skirts on the horizontal axis and handbags on the vertical axis, illustrate two of the consumer's optimal consumption bundles of skirts and handbags. 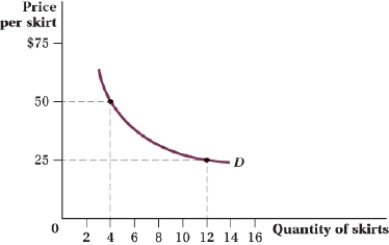
Correct Answer:

Verified
Correct Answer:
Verified
Q63: (Figure: Market for DS Video Games I)
Q64: Joaquin consumes pizza and beer. His utility
Q65: Suppose the price of a Giffen good,
Q66: A consumer's bundle includes two normal goods,
Q67: (Figure: Units of Good Y and Good
Q69: A consumer's bundle includes good X and
Q70: (Figure: Hourly Wage and Hours of Labor
Q71: (Figure: Good Y and Good X V)
Q72: We can use the calculus of the
Q73: (Figure: Good Y and Good X VII)