Multiple Choice
(Figure: Price and Quantity VII) The area that represents the deadweight loss from the change in demand from D1 to D2 is: 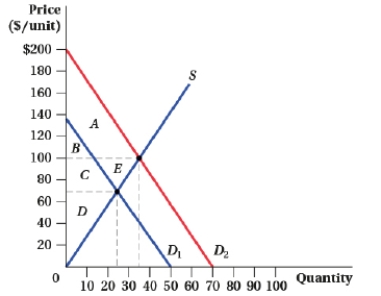
A) There is no deadweight loss.
B) A + E.
C) B + C.
D) D.
Correct Answer:

Verified
Correct Answer:
Verified
Related Questions
Q50: Many states have minimum price laws for
Q51: The deadweight loss (owing to a price
Q52: Suppose that the demand curve for brown
Q53: (Figure: Market for Magazines I) The supply
Q54: (Figure: Market for Snow Blowers I) The
Q56: (Figure: Price and Quantity VII) The area
Q57: When demand and supply are linear, consumer
Q58: The demand and supply curves for a
Q59: Suppose the demand and supply curves for
Q60: The supply and demand for solar panels