Multiple Choice
(Figure: Market for Enplanements) From the year 2000 to 2001, the demand curve for air travel shifted inward, from D2000 to D2001. In 2000, the equilibrium price and quantity were $122.22 and 148.9 million enplanements, respectively. In 2001, the equilibrium price and quantity fell to $104.82 and 123.6 million enplanements, respectively. The loss in producer surplus attributable to the decrease in demand is equal to area: 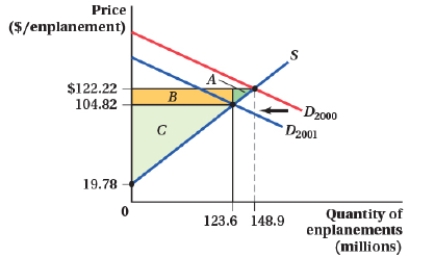
A) A.
B) A + B.
C) B + C.
D) B.
Correct Answer:

Verified
Correct Answer:
Verified
Q87: The market for plywood (a sheet of
Q88: Suppose that a local government has imposed
Q89: (Figure: Market for Good X II) Before
Q90: (Figure: Market for Asparagus I) Suppose the
Q91: (Figure: Market for Peanuts II) At a
Q93: If the government subsidizes the production of
Q94: (Figure: Market for Golf I) The supply
Q95: Suppose that a local government has imposed
Q96: Suppose the demand and supply curves for
Q97: In 2007, Hawaii began providing universal health