Essay
(Figure: Public Goods) The graph shows the marginal benefit curves for two consumers of a public good. 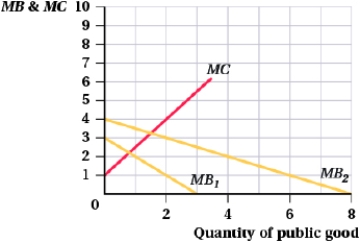
a. Graph the total marginal benefit curve.
b. What is the total marginal benefit of 4 units of a public good?
c. What is the efficient quantity of the public good?
Correct Answer:

Verified
a. Vertically adding MB1 to MB2 ...View Answer
Unlock this answer now
Get Access to more Verified Answers free of charge
Correct Answer:
Verified
View Answer
Unlock this answer now
Get Access to more Verified Answers free of charge
Q28: (Figure: Market Efficiency) If the socially optimal
Q29: The marginal cost of pollution is MC
Q30: Suppose that, at the current level of
Q31: Inverse demand for a product is given
Q32: Sweet Steel and Molten Metal produce sulfur
Q34: (Figure: External Marginal Cost I) The external
Q35: Hamid and Lee are neighbors. Hamid has
Q36: Minnesota has two oil refineries that emit
Q37: Suppose the market for dry cleaning has
Q38: (Table: Benefits and Costs of Lawn Mowing)