Multiple Choice
(Figure: Marginal Productivity of Apple Pickers I) Assume that the price per pound of apples has increased. Which graph best illustrates this change? 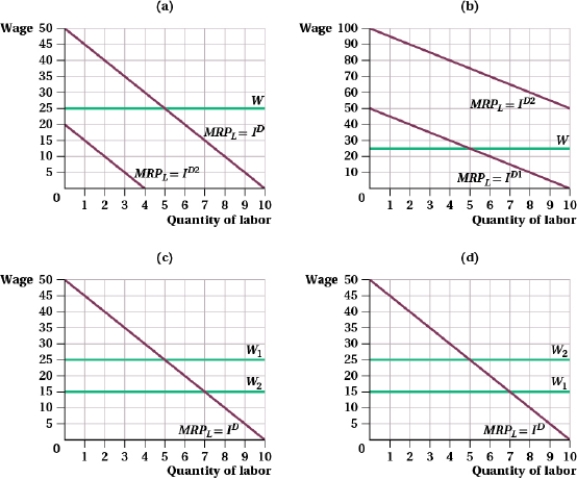
A) (a)
B) (b)
C) (c)
D) (d)
Correct Answer:

Verified
Correct Answer:
Verified
Related Questions
Q60: (Table: Demand for Labor I) <img src="https://d2lvgg3v3hfg70.cloudfront.net/TB8428/.jpg"
Q61: (Table: Demand for Labor I) The table
Q62: Suppose the demand faced by a labor
Q63: The marginal revenue product of labor is
Q64: (Table: Short-run Production Function I) The table
Q66: Use an example to explain why labor
Q67: (Table: Marginal Expenditure Curve I) Explain why
Q68: If the marginal cost of labor curve
Q69: A labor market monopsony faces a(n):<br>A) horizontal
Q70: Use your understanding of marginal revenue product