Multiple Choice
(Figure: Market for Two-Firm Industry II) The graph depicts the market demand curve for a two-firm industry with no fixed costs. 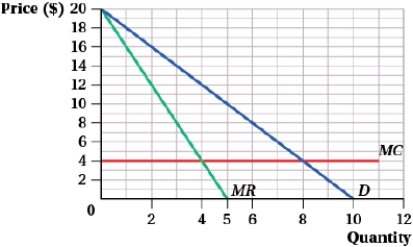 Suppose that the two firms are colluding by acting like a monopolist, with each firm producing half the market output. If one of the firms cheats on the cartel agreement and produces an additional unit of output, its profits will rise from:
A) $16 to $18.
B) $32 to $36.
C) $24 to $32.
D) $16 to $24.
Correct Answer:

Verified
Correct Answer:
Verified
Q46: Consider two firms engaged in Bertrand competition
Q47: (Table: Gascolator Producers I) Banner and Sense
Q48: Suppose the outboard motor market is characterized
Q49: Suppose two Bertrand firms produce similar but
Q50: Suppose two sweaters compete in a Bertrand
Q52: Two firms, Aero and Pareto, produce parachutes.
Q53: Suppose that Mystic Energy and E-Storm are
Q54: In the Cournot model, under the assumption
Q55: Gotcha, the only seller of stun guns,
Q56: Two firms are producing identical goods in