Multiple Choice
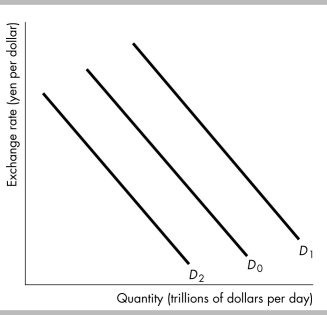
-In the figure above, the shift in the demand curve for U.S. dollars from D0 to D2 could occur when
A) the expected future exchange rate increases.
B) the U.S. interest rate rises.
C) people expect that the dollar will appreciate.
D) foreign interest rates rise.
Correct Answer:

Verified
Correct Answer:
Verified
Q95: Relative to the yen, from 2007-2012 the
Q96: The value of net exports increases when
Q97: Today the U.S. dollar is worth 1.5
Q98: <img src="https://d2lvgg3v3hfg70.cloudfront.net/TB8586/.jpg" alt=" -The data in
Q99: Hyundai is a large South Korean company
Q101: The European Commission believes that in 2020
Q102: If there is an increase in the
Q103: <img src="https://d2lvgg3v3hfg70.cloudfront.net/TB8586/.jpg" alt=" -The table above
Q104: Other things remaining the same, if the
Q105: If the exchange rate between the dollar