menu-iconExamlexExamLexServices

Discover

Ask a Question
  1. All Topics
  2. Topic
    Business
  3. Study Set
    Economics-Macroeconomics
  4. Exam
    Exam 9: The Exchange Rate and the Balance of Payments
  5. Question
    -In the Figure Above, the Shift in the Supply Curve
Solved

-In the Figure Above, the Shift in the Supply Curve

Question 397

Question 397

Multiple Choice

  -In the figure above, the shift in the supply curve for U.S. dollars from S<sub>0</sub> to S<sub>1</sub> could occur when A)  the U.S. interest rate falls. B)  foreign interest rates fall. C)  the expected future exchange rate falls. D)  the current exchange rate falls.
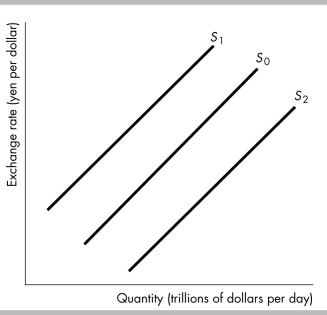
-In the figure above, the shift in the supply curve for U.S. dollars from S0 to S1 could occur when


A) the U.S. interest rate falls.
B) foreign interest rates fall.
C) the expected future exchange rate falls.
D) the current exchange rate falls.

Correct Answer:

verifed

Verified

Unlock this answer now
Get Access to more Verified Answers free of charge

Related Questions

Q392: If the target exchange rate is 100

Q393: Which of the following are included in

Q394: If the current account balance is $235

Q395: The demand curve for U.S. dollars slopes

Q396: Suppose the U.S. interest rate is 6

Q398: All of the following are a current

Q399: How does the Fed intervene in the

Q400: <img src="https://d2lvgg3v3hfg70.cloudfront.net/TB8586/.jpg" alt=" -In the figure

Q401: <img src="https://d2lvgg3v3hfg70.cloudfront.net/TB8586/.jpg" alt=" -The above table

Q402: In October 2008, Iceland's central bank increased

Examlex

ExamLex

About UsContact UsPerks CenterHomeschoolingTest Prep

Work With Us

Campus RepresentativeInfluencers

Links

FaqPricingChrome Extension

Download The App

Get App StoreGet Google Play

Policies

Privacy PolicyTerms of ServiceHonor CodeCommunity Guidelines

Scan To Download

qr-code

Copyright © (2025) ExamLex LLC.

Privacy PolicyTerms Of ServiceHonor CodeCommunity Guidelines