Multiple Choice
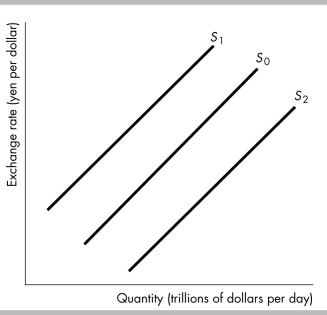
-In the figure above, the shift in the supply curve for U.S. dollars from S0 to S2 could occur when
A) the expected future exchange rate falls.
B) the U.S. interest rate differential increases.
C) the expected future exchange rate rises.
D) the current exchange rate falls.
Correct Answer:

Verified
Correct Answer:
Verified
Q215: In the short run, a change in
Q216: Since the mid-1980s, the United States has
Q217: A country that borrows more from the
Q218: Suppose that U.S. inflation is 3 percent
Q219: How will an increase in the expected
Q221: <img src="https://d2lvgg3v3hfg70.cloudfront.net/TB8586/.jpg" alt=" -In the figure
Q222: <img src="https://d2lvgg3v3hfg70.cloudfront.net/TB8586/.jpg" alt=" -In the above
Q223: The _ the expected profit from holding
Q224: <img src="https://d2lvgg3v3hfg70.cloudfront.net/TB8586/.jpg" alt=" -In the figure
Q225: <img src="https://d2lvgg3v3hfg70.cloudfront.net/TB8586/.jpg" alt=" -The figure above