Essay
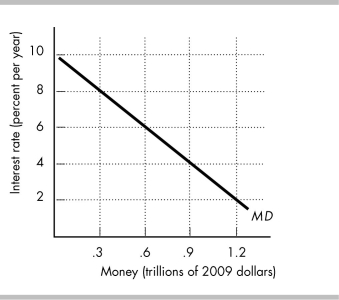
-The above figure has the demand for money curve. Suppose the Fed initially sets the quantity of money equal to $0.6 trillion. Draw the supply of money curve in the figure. What is the equilibrium interest rate? Now suppose the Fed increases the quantity of money to $0.9 trillion. Draw the new supply curve. What is the new equilibrium interest rate?
Correct Answer:

Verified
 The initial supply of money curve is MS...
View Answer
Unlock this answer now
Get Access to more Verified Answers free of charge
Correct Answer:
Verified
View Answer
Unlock this answer now
Get Access to more Verified Answers free of charge
Q568: How does a currency drain affect the
Q569: Commercial banks are able to create money
Q570: The money aggregate M1 consists of<br>A) currency
Q571: <img src="https://d2lvgg3v3hfg70.cloudfront.net/TB8586/.jpg" alt=" -In the above
Q572: According to the quantity theory of money,
Q573: An argument in favor of 100 percent
Q574: The quantity of money in an economy
Q575: When a bank has unplanned reserves<br>A) it
Q576: You withdraw $2,000 from your account. Your
Q578: An increase in the opportunity cost of