Multiple Choice
The table below shows data for the United States. 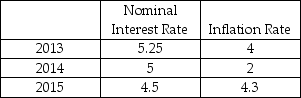 Between 2013 and 2014, the real interest rate ________ and caused a ________ the demand for loanable funds curve.
A) increased; rightward shift
B) decreased; leftward
C) increased; movement upward along
D) decreased; downward along
Correct Answer:

Verified
Correct Answer:
Verified
Q212: If the government runs a budget deficit,
Q213: Suppose that you took out a $1,000
Q214: Changes in all of the following shift
Q215: The term capital, as used in macroeconomics,
Q216: The Ricardo-Barro effect of a government budget
Q218: If the nominal interest rate is 7
Q219: When the inflation rate is negative, the<br>A)
Q220: Technological progress that increases the expected profit
Q221: The greater a household's _ the less
Q222: What are the factors that change the