Multiple Choice
The table below shows data for the U.S. 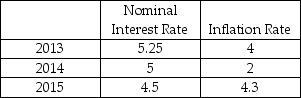 Between 2014 and 2015 the real interest rate ________ and caused a ________ the demand for loanable funds curve.
A) increased; rightward shift
B) decreased; movement down along
C) increased; movement up along
D) decreased; leftward shift
Correct Answer:

Verified
Correct Answer:
Verified
Q72: There is a positive relationship between the
Q73: If foreigners spend more on U.S.-made goods
Q74: Explain how each of the following events
Q75: The demand for loanable funds curve is<br>A)
Q76: According to the Ricardo-Barro effect<br>A) government deficits
Q78: Which of the following influences household saving?<br>I.
Q79: A share of Apple stock has a
Q80: Suppose the current real interest rate is
Q81: The tendency for private saving to increase
Q82: If the real interest rate increases from