Multiple Choice
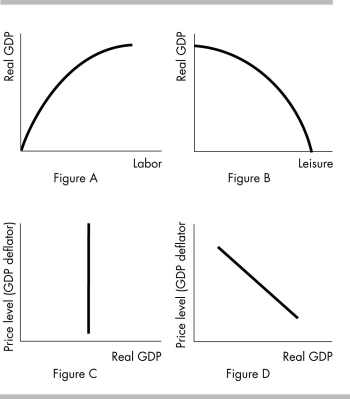
-In the illustration above, which figure shows an aggregate production function?
A) Figure A
B) Figure B
C) Figure C
D) Figure D
Correct Answer:

Verified
Correct Answer:
Verified
Related Questions
Q240: <img src="https://d2lvgg3v3hfg70.cloudfront.net/TB8586/.jpg" alt=" -In the above
Q241: What are the basic arguments of the
Q242: A problem with the neoclassical growth theory
Q243: An assumption of classical growth theory is
Q244: Which of the following will NOT work
Q246: <img src="https://d2lvgg3v3hfg70.cloudfront.net/TB8586/.jpg" alt=" -The
Q247: <img src="https://d2lvgg3v3hfg70.cloudfront.net/TB8586/.jpg" alt=" -In the above
Q248: The curvature of the production function shows
Q249: The demand for labor curve<br>A) is downward
Q250: Employment and (total) potential GDP increase if