Multiple Choice
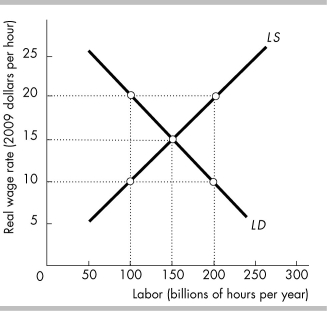
-In the above figure, the equilibrium level of labor is
A) 100 billion hours.
B) 150 billion hours.
C) 200 billion hours.
D) none of the above
Correct Answer:

Verified
Correct Answer:
Verified
Related Questions
Q220: Hu Tells Leaders China Growth Will Help
Q221: Neoclassical growth theory attributes economic growth to<br>A)
Q222: The assumption that population growth will lead
Q223: An increase in a nation's population results
Q224: Since 1980, there has been substantial closure
Q226: The demand for labor curve is<br>A) upward
Q227: During World War II, the increasing productivity
Q228: All of the following would stimulate economic
Q229: Which of the following is used to
Q230: Which of the following ideas apply to