Multiple Choice
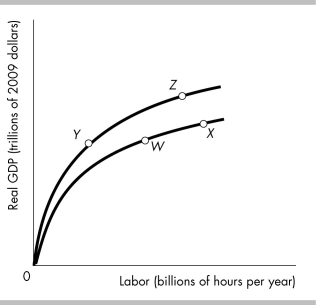
-The figure above shows the U.S. production function. From 1986 to 2008 the United States experienced major advances in technology as well as an increase in the working-age population. The combined effect can best be shown by a
A) movement from point W to point X.
B) movement from point Y to point Z.
C) movement from point Y to point X.
D) movement from point W to point Z.
Correct Answer:

Verified
Correct Answer:
Verified
Q303: The Industrial Revolution in England in large
Q304: The relationship between the labor employed by
Q305: Because of the choices people make in
Q306: Over the last 100 years, the average
Q307: <img src="https://d2lvgg3v3hfg70.cloudfront.net/TB8586/.jpg" alt=" -As a result
Q309: If real GDP per person is growing
Q310: Because the productivity of labor decreases as
Q311: If the real wage rate is such
Q312: The neoclassical growth theory is based on
Q313: If real GDP is $13,000 billion and