Multiple Choice
The table below shows data for China. 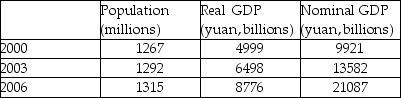 The standard of living between 2003 and 2006 increased by
A) 55.3 percent.
B) 1.8 percent.
C) 35 percent.
D) 32.7 percent.
Correct Answer:

Verified
Correct Answer:
Verified
Related Questions
Q214: What is the main difference between classical
Q215: The aggregate production function<br>A) measures the productivity
Q216: The table below shows data for China.
Q217: During 2017, the country of Economia had
Q218: Human capital is the<br>A) machinery used by
Q220: Hu Tells Leaders China Growth Will Help
Q221: Neoclassical growth theory attributes economic growth to<br>A)
Q222: The assumption that population growth will lead
Q223: An increase in a nation's population results
Q224: Since 1980, there has been substantial closure