Multiple Choice
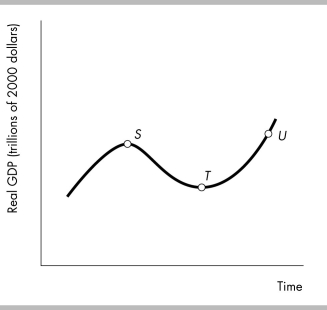
-In the above figure, the distance between points S and T represents
A) an expansion.
B) a trough.
C) a peak.
D) a recession.
Correct Answer:

Verified
Correct Answer:
Verified
Related Questions
Q296: The circular flow diagram shows<br>A) how nominal
Q297: Total output and total income in the
Q298: The circular flow diagram shows that the
Q299: According to the BEA, in the second
Q300: To measure GDP using the expenditure approach
Q302: Explain how GDP is measured according to
Q303: GDP using the expenditure approach equals the
Q304: The approach to GDP that sums compensation
Q305: A time-series graph reveals whether there is
Q306: Gross domestic product is a measure of