Multiple Choice
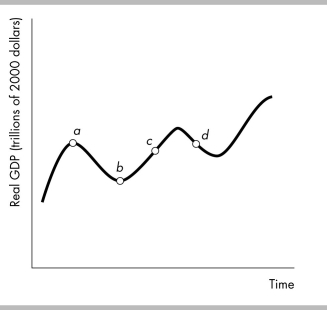
-In the above figure, a trough is at point ________ and a peak is at point ________.
A) a; b
B) b; c
C) b; a
D) d; c
Correct Answer:

Verified
Correct Answer:
Verified
Related Questions
Q162: <img src="https://d2lvgg3v3hfg70.cloudfront.net/TB8586/.jpg" alt=" -Using the data
Q163: Is every product produced in the United
Q164: The difference between gross investment and net
Q165: Which, if any, of the following causes
Q166: The circular flow diagram shows that<br>A) the
Q168: Two reasons why valuing goods at their
Q169: Which of the following is included in
Q170: The circular flow of income shows that<br>A)
Q171: The following data show Uruguay's GDP using
Q172: Which of the following is NOT part