Essay
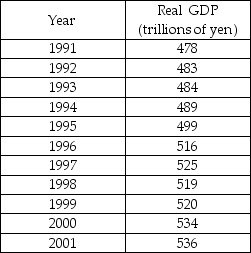
-The table above shows Japan's real GDP between 1991 to 2001.
a) Draw a figure with Japan's real GDP from 1991 to 2001.
b) In the previous 30 years, the growth rate of Japan's potential GDP was 6 percent a year. On your graph, show the path that potential GDP would have followed if its GDP in 1991 was equal to potential GDP and the growth rate of potential GDP had been maintained in 1991-2001.
c) Show the Lucas wedge on your figure.
Correct Answer:

Verified
 a) See the figure above.
b) Potential G...View Answer
Unlock this answer now
Get Access to more Verified Answers free of charge
Correct Answer:
Verified
b) Potential G...
View Answer
Unlock this answer now
Get Access to more Verified Answers free of charge
Q43: According to the circular flow diagram, the
Q44: <img src="https://d2lvgg3v3hfg70.cloudfront.net/TB8586/.jpg" alt=" -Using the information
Q45: A ton of coal purchased by your
Q46: A loaf of bread purchased by one
Q47: The factor market can best be described
Q49: Which of the following is not a
Q50: Let C represent consumption expenditure, S saving,
Q51: Of the following, the largest component of
Q52: The circular flow model shows that consumer
Q53: An increase in exports of goods or