Multiple Choice
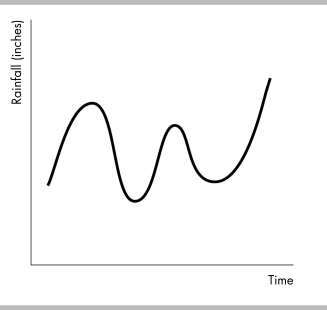
-The figure above shows a
A) two-variable time-series graph.
B) time-series graph.
C) scatter diagram.
D) regression.
Correct Answer:

Verified
Correct Answer:
Verified
Related Questions
Q211: The underground economy means that GDP will
Q212: In the circular flow model of an
Q213: <img src="https://d2lvgg3v3hfg70.cloudfront.net/TB8586/.jpg" alt=" -The above table
Q214: <img src="https://d2lvgg3v3hfg70.cloudfront.net/TB8586/.jpg" alt=" -In the above
Q215: _ gross domestic product is the value
Q217: The presence of _ creates a difference
Q218: Real GDP measures the<br>A) total profits earned
Q219: Real GDP decreases during<br>A) the movement from
Q220: All of the following are included in
Q221: If depreciation exceeds gross investment, net investment