Multiple Choice
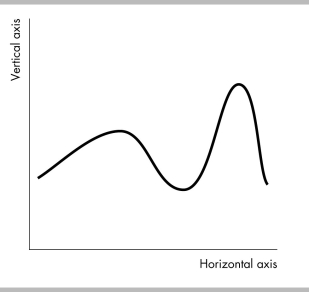
-The figure above shows a time-series graph. The horizontal axis measures ________ and the vertical axis measures ________.
A) time; x-values
B) time; the variable of interest
C) the variable of interest; time
D) y-values; the variable of interest
Correct Answer:

Verified
Correct Answer:
Verified
Q237: Gross Domestic Product is equal to the
Q238: "Life expectancy is exceptionally high in Japan.
Q239: Gross investment equals<br>A) net investment - depreciation
Q240: If an American firm produces goods that
Q241: The largest component of income is proprietors'
Q243: An U.S. firm buys a new industrial
Q244: Investment, as included in GDP, consists of
Q245: If Frito Lay, an American snack company,
Q246: On a time-series graph, time is typically
Q247: By itself, an increase in exports<br>A) increases