Multiple Choice
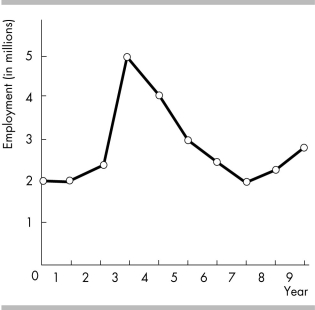
-According to the graph in the figure above, which year experienced the most rapid change in employment?
A) Year 2
B) Year 3
C) Year 4
D) Year 5
Correct Answer:

Verified
Correct Answer:
Verified
Related Questions
Q73: _ refers to a period when the
Q74: Net investment is the<br>A) total amount of
Q75: Potential GDP is<br>A) another name for real
Q76: Which of the following is CORRECT about
Q77: <img src="https://d2lvgg3v3hfg70.cloudfront.net/TB8586/.jpg" alt=" -The table above
Q79: Transfer payments are not part of government
Q80: Which of the following transfer payments is
Q81: Depreciation is defined as the<br>A) decrease in
Q82: Gross domestic product (GDP) is the _
Q83: In any year, real GDP<br>A) must always