Multiple Choice
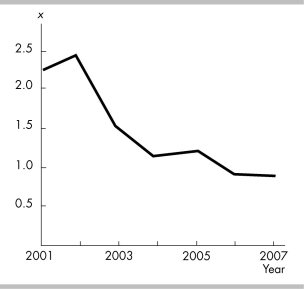
-In the above figure, the diagram shows
A) a downward trend in x.
B) an upward trend in x.
C) a scatter diagram.
D) a two-variable scatter diagram.
Correct Answer:

Verified
Correct Answer:
Verified
Q56: <img src="https://d2lvgg3v3hfg70.cloudfront.net/TB8586/.jpg" alt=" -In the above
Q57: In years with inflation, nominal GDP increases
Q58: GDP does not directly include intermediate goods
Q59: Explain how gross investment, depreciation, net investment,
Q60: The largest component of national income is<br>A)
Q62: <img src="https://d2lvgg3v3hfg70.cloudfront.net/TB8586/.jpg" alt=" -In the above
Q63: <img src="https://d2lvgg3v3hfg70.cloudfront.net/TB8586/.jpg" alt=" -In the above
Q64: When calculating the compensation of employees part
Q65: <img src="https://d2lvgg3v3hfg70.cloudfront.net/TB8586/.jpg" alt=" -Using the data
Q66: Government expenditures included in the expenditure approach