Multiple Choice
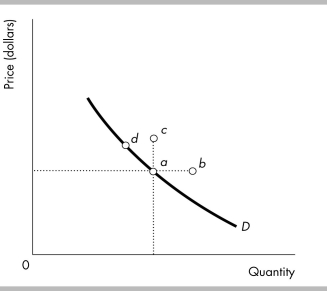
-In the above figure, an increase in the quantity demanded is represented by a movement from point d to
A) point b only.
B) point c only.
C) point a.
D) both points b and c.
Correct Answer:

Verified
Correct Answer:
Verified
Q280: The equilibrium price will rise and the
Q281: <img src="https://d2lvgg3v3hfg70.cloudfront.net/TB8586/.jpg" alt=" -In the above
Q282: The quantity supplied of a good is<br>A)
Q283: The price of cereal rises. As a
Q284: The price of a DVD rental is
Q286: <img src="https://d2lvgg3v3hfg70.cloudfront.net/TB8586/.jpg" alt=" -The figure above
Q287: <img src="https://d2lvgg3v3hfg70.cloudfront.net/TB8586/.jpg" alt=" -In the figure
Q288: <img src="https://d2lvgg3v3hfg70.cloudfront.net/TB8586/.jpg" alt=" -The above figure
Q289: The statement that "demand increases" means that
Q290: If good A is a normal good