Multiple Choice
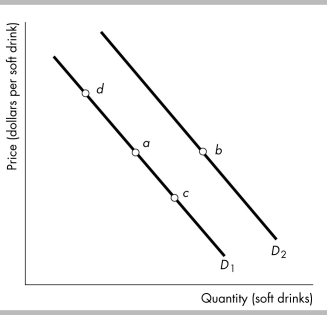
-Consider the demand curves for soft drinks shown in the figure above. Moving from point a to point c means that
A) the marginal benefit of each additional soft drink falls.
B) the opportunity cost of another soft drink increases.
C) people's incomes have decreased.
D) the price of a soft drink has increased.
Correct Answer:

Verified
Correct Answer:
Verified
Q304: A consumer might consider in-line skates and
Q305: <img src="https://d2lvgg3v3hfg70.cloudfront.net/TB8586/.jpg" alt=" -The figure above
Q306: Kelly graduates and her income increases by
Q307: Suppose the equilibrium price for soft drinks
Q308: The law of demand implies that if
Q310: Which of the following raises the equilibrium
Q311: When both the demand for a good
Q312: <img src="https://d2lvgg3v3hfg70.cloudfront.net/TB8586/.jpg" alt=" -The figure above
Q313: Consumers expect that the price of a
Q314: If the price per bushel of apples