Multiple Choice
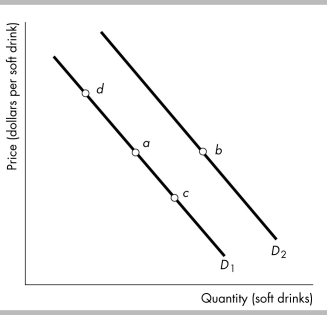
-Consider the demand curves for soft drinks shown in the figure above. A movement from point a to point b represents
A) a decrease in quantity demanded.
B) an increase in demand.
C) an increase in quantity demanded.
D) a decrease in demand.
Correct Answer:

Verified
Correct Answer:
Verified
Related Questions
Q132: The "law of demand" states that, other
Q133: What is the difference between a normal
Q134: Personal computers are becoming less expensive as
Q135: A demand curve is also a willingness-and-ability-to-pay
Q136: A relative price is the product of
Q138: When the price of an inferior good
Q139: Bicycles are made out of steel. If
Q140: Which of the following CORRECTLY describes how
Q141: Wages for workers producing iPods and similar
Q142: A complement is a good<br>A) of lower