Multiple Choice
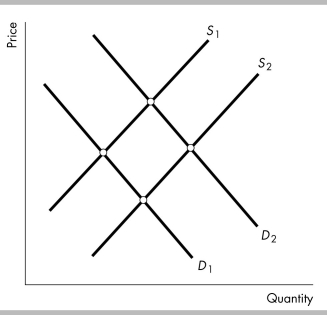
-The above figure shows the market for gasoline. When a hurricane destroys a major refinery that refines oil into gasoline, the
A) demand curve for gasoline shifts from D1 to D2 and the supply curve of gasoline does not shift.
B) demand curve for gasoline shifts from D1 to D2 and the supply curve of gasoline shifts from S2 to S1.
C) demand curve for gasoline does not shift, and the supply curve of gasoline shifts from S2 to S1.
D) demand curve for gasoline does not shift, and the supply curve of gasoline shifts from S1 to S2.
Correct Answer:

Verified
Correct Answer:
Verified
Q459: Over the past decade technological improvements that
Q460: If macaroni and cheese is an inferior
Q461: Which of the following increases the quantity
Q462: If there is surplus of a good,
Q463: Consider the market for broccoli. If the
Q465: <img src="https://d2lvgg3v3hfg70.cloudfront.net/TB8586/.jpg" alt=" -Consider the demand
Q466: <img src="https://d2lvgg3v3hfg70.cloudfront.net/TB8586/.jpg" alt=" -The figure illustrates
Q467: <img src="https://d2lvgg3v3hfg70.cloudfront.net/TB8586/.jpg" alt=" -The above figures
Q468: Which of the following shifts the supply
Q469: If the demand for digital cameras increases