Multiple Choice
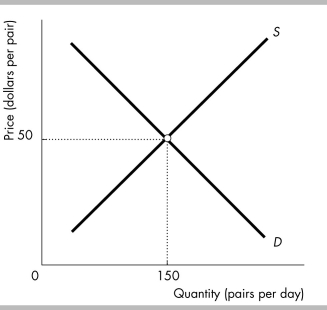
-The figure illustrates the demand for and supply for jeans. Suppose jeans are a normal good and people's incomes increase. At the initial price of $50 for a pair of jeans, after the increase in income the quantity demanded is ________ than the equilibrium quantity and there is a ________ of jeans.
A) greater; surplus
B) greater; shortage
C) less; surplus
D) less; shortage
Correct Answer:

Verified
Correct Answer:
Verified
Q10: Suppose we observe that both the equilibrium
Q11: The "law of demand" states that changes
Q12: Between 2000 and 2015, advances in PC
Q13: <img src="https://d2lvgg3v3hfg70.cloudfront.net/TB8586/.jpg" alt=" -The above figures
Q14: Crude oil can be refined into home
Q16: Auto workers negotiate a wage increase. How
Q17: The price of the steel used to
Q18: The quantity supplied of a good or
Q19: <img src="https://d2lvgg3v3hfg70.cloudfront.net/TB8586/.jpg" alt=" -The above figure
Q20: If the price of aluminum used to