Multiple Choice
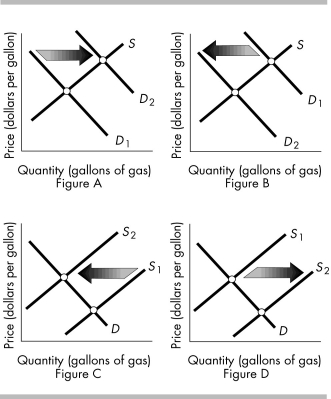
-The above figures show the market for gasoline. Which figure shows the effect of an increased preference for cars that are smaller and more fuel efficient?
A) Figure A
B) Figure B
C) Figure C
D) Figure D
Correct Answer:

Verified
Correct Answer:
Verified
Q98: Which of the following shifts the demand
Q99: <img src="https://d2lvgg3v3hfg70.cloudfront.net/TB8586/.jpg" alt=" -The figure above
Q100: Growers expect that the price of a
Q101: Suppose the price of a football is
Q102: <img src="https://d2lvgg3v3hfg70.cloudfront.net/TB8586/.jpg" alt=" -The figure above
Q104: <img src="https://d2lvgg3v3hfg70.cloudfront.net/TB8586/.jpg" alt=" -Consider the demand
Q105: Which of the following will NOT shift
Q106: By definition, an inferior good is a<br>A)
Q107: Until 2007, the price of sport utility
Q108: An increase in the price of jet