Multiple Choice
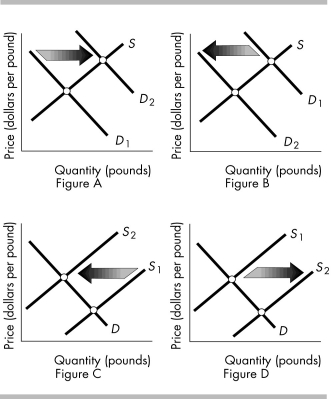
-The above figures show the market for oranges. Which figure(s) shows the effect of a nation-wide consumer boycott of eating oranges?
A) Figure B
B) Figure C
C) Figures B and C
D) Figures A and D
Correct Answer:

Verified
Correct Answer:
Verified
Related Questions
Q318: The initial supply and demand curves for
Q319: If the demand and supply curves are
Q320: An increase in technology for producing personal
Q321: <img src="https://d2lvgg3v3hfg70.cloudfront.net/TB8586/.jpg" alt=" -In the above
Q322: The equilibrium quantity will decrease and the
Q324: A fall in the price of a
Q325: Beef is a normal good and people's
Q326: When there is a surplus in the
Q327: A change in which of the following
Q328: During the last decade, the price of