Multiple Choice
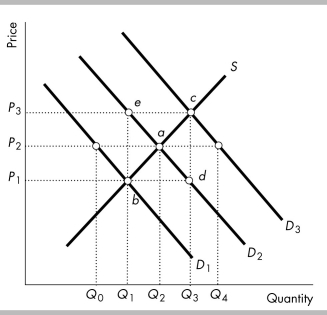
-In the above figure, if D2 is the original demand curve and the population falls, which price and quantity might result?
A) point a, with price P2 and quantity Q2
B) point b, with price P1 and quantity Q1
C) point c, with price P3 and quantity Q3
D) point d, with price P1 and quantity Q3
Correct Answer:

Verified
Correct Answer:
Verified
Q215: <img src="https://d2lvgg3v3hfg70.cloudfront.net/TB8586/.jpg" alt=" -The above figures
Q216: A change in the price of a
Q217: What will happen to the equilibrium price
Q218: <img src="https://d2lvgg3v3hfg70.cloudfront.net/TB8586/.jpg" alt=" -Consider the demand
Q219: In 2015, the price of peanuts was
Q221: In 2012 Nike reduced the price of
Q222: General Electric (GE) produces wind turbines that
Q223: <img src="https://d2lvgg3v3hfg70.cloudfront.net/TB8586/.jpg" alt=" -The figure above
Q224: As the relative price of a good
Q225: Which of the following shifts the supply