Multiple Choice
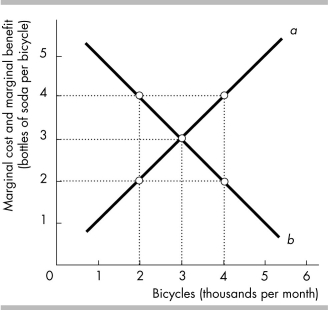
-In the above figure, the curve labeled a is the ________ curve and the curve labeled b is the ________ curve.
A) marginal cost; marginal benefit
B) marginal cost; trade line
C) marginal benefit; trade line
D) production possibilities frontier; trade line
Correct Answer:

Verified
Correct Answer:
Verified
Q427: <img src="https://d2lvgg3v3hfg70.cloudfront.net/TB8586/.jpg" alt=" -In the figure
Q428: Marginal cost curves slope<br>A) upward because of
Q429: Individual economic decisions are coordinated by<br>A) markets
Q430: <img src="https://d2lvgg3v3hfg70.cloudfront.net/TB8586/.jpg" alt=" -In the production
Q431: One of the opportunity costs of economic
Q433: Suppose the country of Popcorn produces only
Q434: When we choose a particular option, we
Q435: Missouri can produce 10,000 tons of pecans
Q436: <img src="https://d2lvgg3v3hfg70.cloudfront.net/TB8586/.jpg" alt=" -The table above
Q437: The slope of a production possibilities frontier